
Equalization is an increasingly controversial federal program, but there are many misconceptions about it. This federal program is supposed to be aimed at ensuring each province can “provide reasonably comparable levels of public services at reasonably comparable levels of taxation” as per sec. 36(2) of the Constitution. Our analysis will first provide a basic overview and then propose eight solutions to ways the program either falls short of or overshoots its Constitutional basis.
Funding for Equalization comes from federal taxes and goes directly to provincial governments calculated to be below average in “fiscal capacity.” Albertans’ higher per capita tax payments mean they have been making a net contribution of $15-27 billion annually – over $3 billion of that goes towards the $20 billion Equalization program. This is entirely a “net” contribution since Alberta receives no payments.
What is less obvious is that Albertans have been making a similarly large net contribution to federal-provincial transfers through the Canada Health Transfer (CHT) and Canada Social Transfer (CST). They pay in about $9 billion (based on their 16-17% share of tax revenues) but only get roughly $6 billion back (based on their 11.5% share of population). When this $3 billion net contribution is combined with the Equalization contribution, that is more than $6 billion from Albertans’ federal taxes going directly to other provincial governments to fund their provincial services.
Put another way, Albertans in recent years have had about $6000 per family of four sent from Ottawa – annually – to other provincial governments to fund health and social services through CHT, CST, and Equalization alone.
This $6 billion figure is only one part of the larger $15-27 billion per annum total net transfer from Albertans to the rest of the country. This larger figure is explained in detail in the “Fiscal Fairness” section at www.fairnessalberta.ca.
This degree of redistribution goes beyond anything required by the Constitution, and it is hard in principle to justify taking such a large sum from taxpayers in one province and sending it to other provincial governments to meet their provincial responsibilities. This dilemma becomes particularly acute as Alberta’s government struggles to tackle one of the largest provincial deficits in Canada.
Additionally, Equalization dampens the incentive for provinces to seek to expand their own fiscal capacity, even creating a perverse incentive not to approve economic development that has political controversy surrounding it since the gains to provincial coffers will be to some extent offset by lower equalization payments.
It is also notable that the formula solely looks at equalizing revenues, without taking into account what funds would actually be required in different provinces to deliver equal services once relative inflation and cost-of-living levels are taken into account.
Rather than just highlight problems, however, Fairness Alberta has eight concrete proposals for reform that we believe would bring more fairness to the Equalization program by making the fiscal arrangements around it more transparent, affordable, flexible, and inclusive. We believe this will also strengthen Canada as a whole.
Funding the health and social transfers by transferring tax points to the provinces would address this duplication in a principled way that has historical precedent.[2] “Tax points” come in different forms, but those we have in mind would feature the federal government dropping tax points to the equivalent value of these transfers and inviting the provinces to raise their tax rates by a corresponding amount to fund their health and social services.
Based on recent years, this would equate to a $9 billion reduction in federal taxes for Albertans that would presumably be replaced with a $6 billion increase in provincial taxes which is all that would be needed to replace these transfers.
Health and social services are exclusively a provincial responsibility under the constitution and are administered independently. The federal government making this tax point transfer would better ensure that – apart from “Equalization” – the tax dollars Canadians pay for programs covering provincial responsibilities like health and social services are spent in their province, by the provincial government that is accountable to them.
The next three proposals relate to a concern that the overall Equalization Program should be controlled or reduced rather than being tied to GDP. The current program structure with Equalization tied to GDP means the same recipient Provinces get more and more annually regardless of need (in addition to the growing CHT/CST transfers). While not mutually exclusive, given the compounding effect the proposals would have on the Equalization program we offer them for consideration in combination or alone.
Per Capita Equalization Payments to Provinces 2018-2019 ($millions)

Equalization Payment $Millions
*The Territories do not receive equalization payments. They receive Territorial Formula Financing from Finance Canada which is determined through a different process but is included in the federal-provincial transfers total.
In the most recent year, the recipients of transfers are as follows:
Equalization Payments to “Have Not” Provinces Millions of Dollars | 2019-2020 | 2018-2019 | 2017-2018 | 2016-2017 | 2015-2016 |
|---|---|---|---|---|---|
Quebec
| 13,214 | 11,732 | 11,081 | 10,030 | 9,521 |
Manitoba
| 2, 255 | 2,037 | 1,820 | 1,736 | 1,738 |
Nova Scotia
| 2,015 | 1,933 | 1,779 | 1,722 | 1,690 |
New Brunswick | 2,023 | 1,874 | 1,760 | 1,708 | 1,669 |
Ontario | 0 | 963 | 1,424 | 2,304 | 2,363 |
Prince Edward Island | 419 | 419 | 390 | 380 | 361 |
Total | 19,926 | 18,958 | 18,254 | 17,880 | 17,342 |
Source: Department of Finance
⦁ The Federal Government determines the total amount to be allocated to equalization. Since the 2009-10 fiscal year, this amount has been based on the growth rate of Canada’s GDP. In 2018-2019 this amount was $18.6 billion.
⦁ The Federal Government calculates the three-year weighted average of non-resource fiscal capacity. The “fiscal capacity” of each province is determined based on the amount of revenue that province would raise with tax rates equal to the national average. If a province would raise less than the national average then the Federal Government would make an equalization payment to that province to bring it up to the national average.
⦁ There is a weighted three year moving average calculation made to determine the amount of the payment to any province in any given year, with a two year lag. So the 2018-19 annual payment would be the sum of 50% of its 2016-17 payment +25% of its 2015-16 payment +25% of its 2014-15 payment. This was done to stabilize the year to year payments.
⦁ A determination is made as to whether 50% of resource revenues will or will not be included with tax revenues. The option (50% or 0 ) is used that will result in the highest equalization payment for that province. The “best of” option is used.
⦁ Since all resource revenues are not included, there are situations where a receiving province could benefit too much. In 2009 the Federal Government implemented a “Fiscal Capacity Cap” whereby the combination of own sourced fiscal capacity, including all resource revenues, and the equalization payment to any receiving province cannot exceed the average fiscal capacity of all equalization receiving provinces.
Source: Unpacking Canada’s Equalization Payments for 2018-19. January 17, 2018 BLOG by Trevor Tombe. University of Calgary School of Public Policy.<br>
Source: Canada’s Equalization Formula: Peering Inside the Black Box…And Beyond. September 24 Research Paper by Jim Feehan. University of Calgary School of Public Policy.
As discussed below, Albertans pay a disproportionate amount of Canada’s taxes and receive a disproportionately smaller level of services in return. This is outlined in the section below. Then on top of paying approximately 50% more than we receive, we are faced with the equalization program. This program then penalizes Alberta for our higher earnings and fiscal capacity and then transfers further monies to certain other provinces.
A key structural problem with the formula is that it includes natural resource revenue (50%) in calculating the fiscal capacity of provinces but does not include hydroelectric power revenue (thus primarily providing an advantage to Quebec, but also to some extent providing an advantage to Ontario, BC and Manitoba).
As well, the program has clearly created structural dependencies in Quebec and certain maritime provinces. Quebec’s fiscal plan counts on the large equalization payments and there is no incentive to wean itself off of its dependency. Equalization programs should be transitional in nature and not structural.
As well, the Federal Government makes no effort to ensure that equalization funds are efficiently spent to ensure minimum national standards are met. There is little or no attention given to what constitutes the required public services within the ambit of section 36 of the Charter.
The Federal Government budget does not match its sources of revenue due to its deficit. The sources of revenue by category are set out below (based on Statistics Canada 2017 data):

Based on Statistics Canada 2017 data.
The total contribution by Alberta to the Federal Government is the per capita amount of $11,738 multiplied by the population of 4,262, 642 which is $50.03 Billion. When compared to Alberta’s entire provincial budget of $48 Billion, this amount is extraordinary.
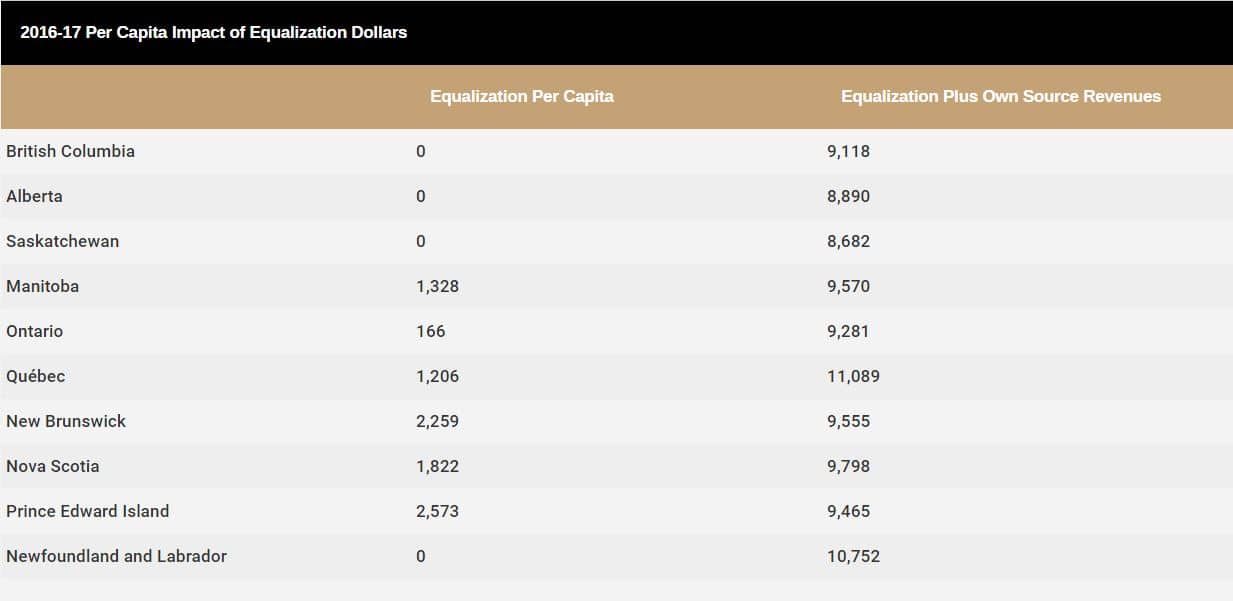
Further, the below table shows equalization per capita and the sum of the two. Notably, except for Newfoundland, the “have not” provinces have higher per capita revenue than the “have” provinces after Equalization is added to own source revenues. Before equalization PEI and New Brunswick have the lowest per capita revenue, however, after Equalization payments, Alberta and Saskatchewan have the lowest per capita revenues. (Source: Equalization payments in Canada, Wikipedia).
2016-17 Per Capita Impact of Equalization Dollars | Equalization
Per Capita | Equalization
Plus Own
Source Revenues |
|---|---|---|
British Columbia | 0 | 9,118 |
Alberta | 0 | 8,890 |
Saskatchewan | 0 | 8,682 |
Manitoba | 1,328 | 9,570 |
Ontario | 166 | 9,281 |
Québec | 1,206 | 11,089 |
New Brunswick | 2,259 | 9,555 |
Nova Scotia | 1,822 | 9,798 |
Prince Edward Island | 2,573 | 9,465 |
Newfoundland and Labrador | 0 | 10,752 |
The transfers to Provinces on a per capita basis are outlined below. It is important to note that the Alberta per capital revenue contribution is approximately 50% higher than the per capita services received.
Federal Revenues and Expenditures by Province, 2017 (in dollars per capita) | National Average | Revenues | Expenditures |
|---|---|---|
British Columbia | 8,736 | 8,408 |
Alberta | 11,738 | 6,642
|
Saskatchewan | 8,641 | 8,322 |
Manitoba | 7,011 | 10,247 |
Ontario | 8,816 | 7,648 |
Québec | 6,397 | 8,355 |
New Brunswick | 6,485 | 12,987 |
Nova Scotia | 6,862 | 14,000 |
Prince Edward Island | 6,150 | 14,814 |
Newfoundland and Labrador | 8,844 | 11,768
|
Analytical work originally done by Fred McDougall (Fred is a Vice President of Fairness Alberta) and later by others, including Robert Mansell of the University of Calgary, focused on the broader net fiscal contributions of the provinces. This goes well beyond the impact of equalization transfers and measures the total funds flowing from provinces to the Federal Government and the funds flowing back to the provinces. This is based on Statistics Canada data. This data is shown below by province in both gross dollars and per capita.
Millions of Dollars | ||||||||
|---|---|---|---|---|---|---|---|---|
Revenue | 2012 | 2013 | 2014 | 2015 | 2016 | 2017 | 2018 | |
Personal income Tax | 21,295 | 23,629 | 25,737 | 26,992 | 22,707 | 24,444 | 25,737 | |
Corporate income Tax | 7,839 | 9,066 | 10,041 | 8,697 | 7,296 | 6,376 | 6,531 | |
Goods and services tax | 4,503 | 4,808 | 5,169 | 5,250 | 5,014 | 5,330 | 5,547 | |
EI Contributions | 2,769 | 3,273 | 3,449 | 3,415 | 3,256 | 2,799 | 2,934 | |
Other Revenue¹ | 4,969 | 5,353 | 5,593 | 5,352 | 5,028 | 5,480 | 5,997 | |
Total Revenue | 41,375 | 46,129 | 49,989 | 49,706 | 43,301 | 44,429 | 46,728 | |
Expenditure | ||||||||
Health and social transfers | 3,855 | 4,143 | 4,733 | 5,273 | 5,551 | 5,860 | 6,077 | |
Final expenditure on goods and services | 4,637 | 4,617 | 4,641 | 4,604 | 4,721 | 5,132 | 5,187 | |
Old age security | 3,150 | 3,277 | 3,434 | 3,621 | 3,823 | 4,106 | 4,407 | |
EI benefits | 1,281 | 1,334 | 1,471 | 2,094 | 3,079 | 2,760 | 2,278 | |
Interest on public debt | 2,999 | 3,036 | 2,857 | 2,720 | 2,553 | 2,488 | 2,748 | |
Other expenditure² | 6,218 | 6,204 | 5,797 | 6,638 | 7,615 | 8,824 | 8,856 | |
Total Expenditure | 22,140 | 22,611 | 22,933 | 24,950 | 27,342 | 29,170 | 29,553 | |
Net Contribution (Revenue less Expenditure) | 19,235 | 23,518 | 27,056 | 24,756 | 15,959 | 15,259 | 17,175 | |
Net Contributions ($ per capita) | 4,964 | 5,908 | 6,625 | 5,973 | 3,803 | 3,596 | 3,994 | |
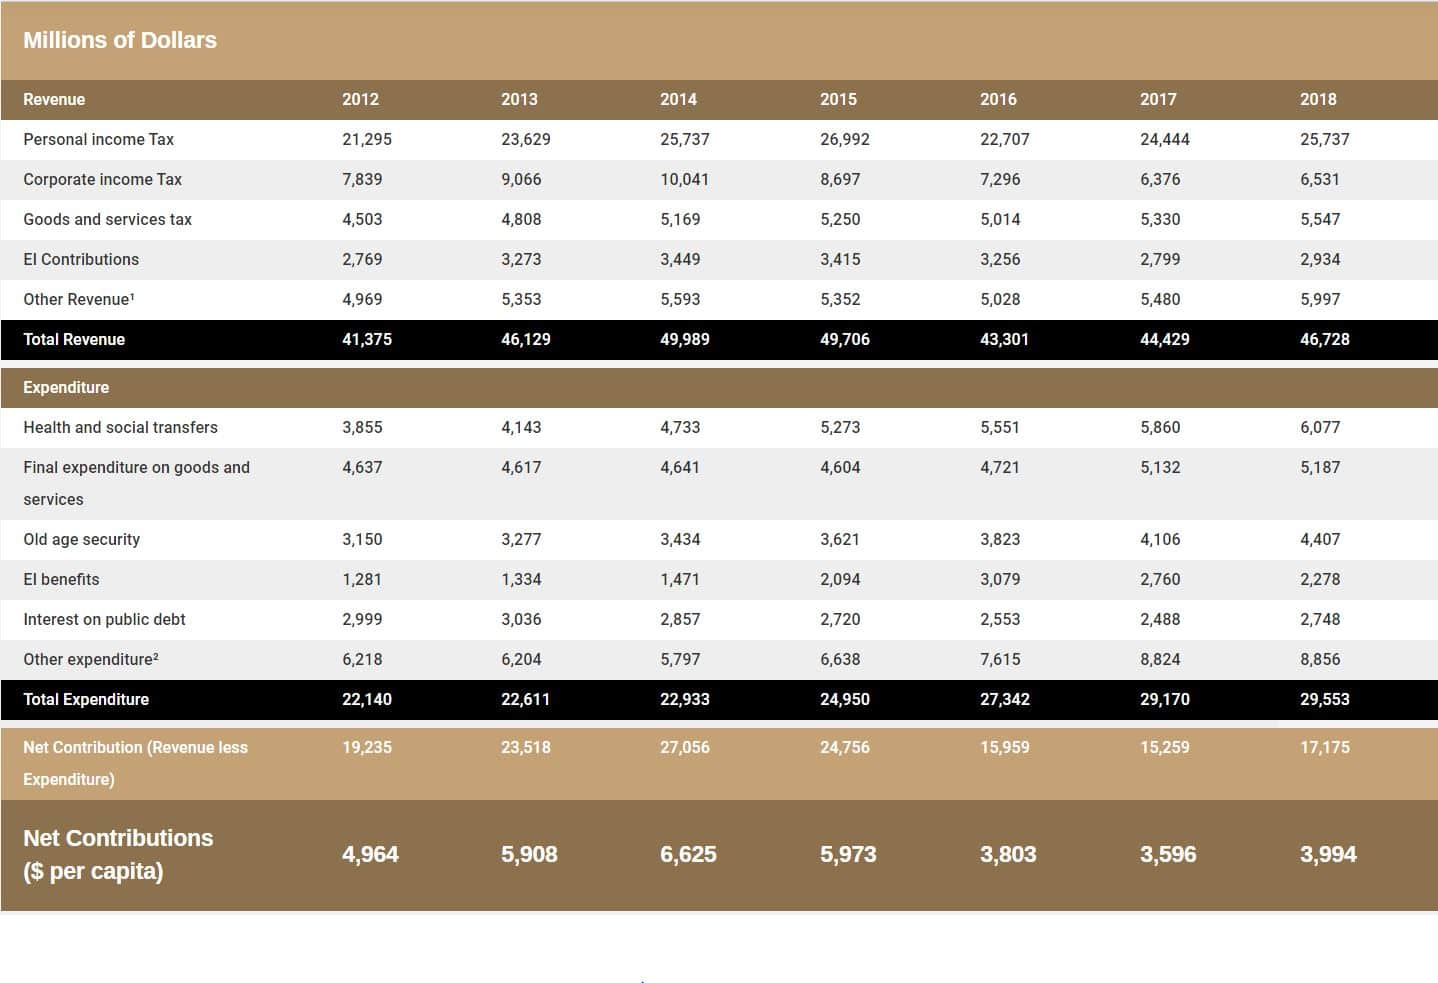
¹ Other revenue – withholding taxes, fuel taxes, excise duties, etc.
² Other expenditure – child benefits, interest on the debt, transfers to aboriginal governments, etc.
Year | Federal Revenue | Federal Expenditure | Net Contribution | 2000 | 22.1 | 14.3 | 7.8 |
|---|---|---|---|
2001
| 22.7 | 14.6 | 8.1 |
2002 | 22.7 | 14.4 | 8.3 |
2003 | 23.6 | 15.8 | 7.8 |
2004 | 26.0 | 16.4 | 9.6 |
2005 | 30.0 | 17.0 | 13.0 |
2006 | 34.6 | 16.8 | 17.8 |
2007 | 38.3 | 17.4 | 20.9 |
2008 | 39.7 | 18.7 | 21.0 |
2009 | 36.0 | 20.0 | 16.0 |
2010 | 36.0 | 20.4 | 15.5 |
2011 | 39.6 | 20.6 | 18.9 |
2012 | 41.4 | 22.1 | 19.3 |
2013 | 46.1 | 22.6 | 23.5 |
2014 | 50.0 | 22.9 | 27.1 |
2015 | 49.7 | 24.9 | 24.8 |
2016 | 43.3 | 27.3 | 16.0 |
2017 | 43.9
| 29.3 | 14.6
|
2018 | 47.2 | 29.8 | 17.4 |
Totals | 629.9 | 385.0 | 307.9 |
Total 19 Year Average/Year | 36.47 | 20.26 | 16.2 |
Last 5 Years Average/Year | 46.82 | 26.78 | 20.08 |
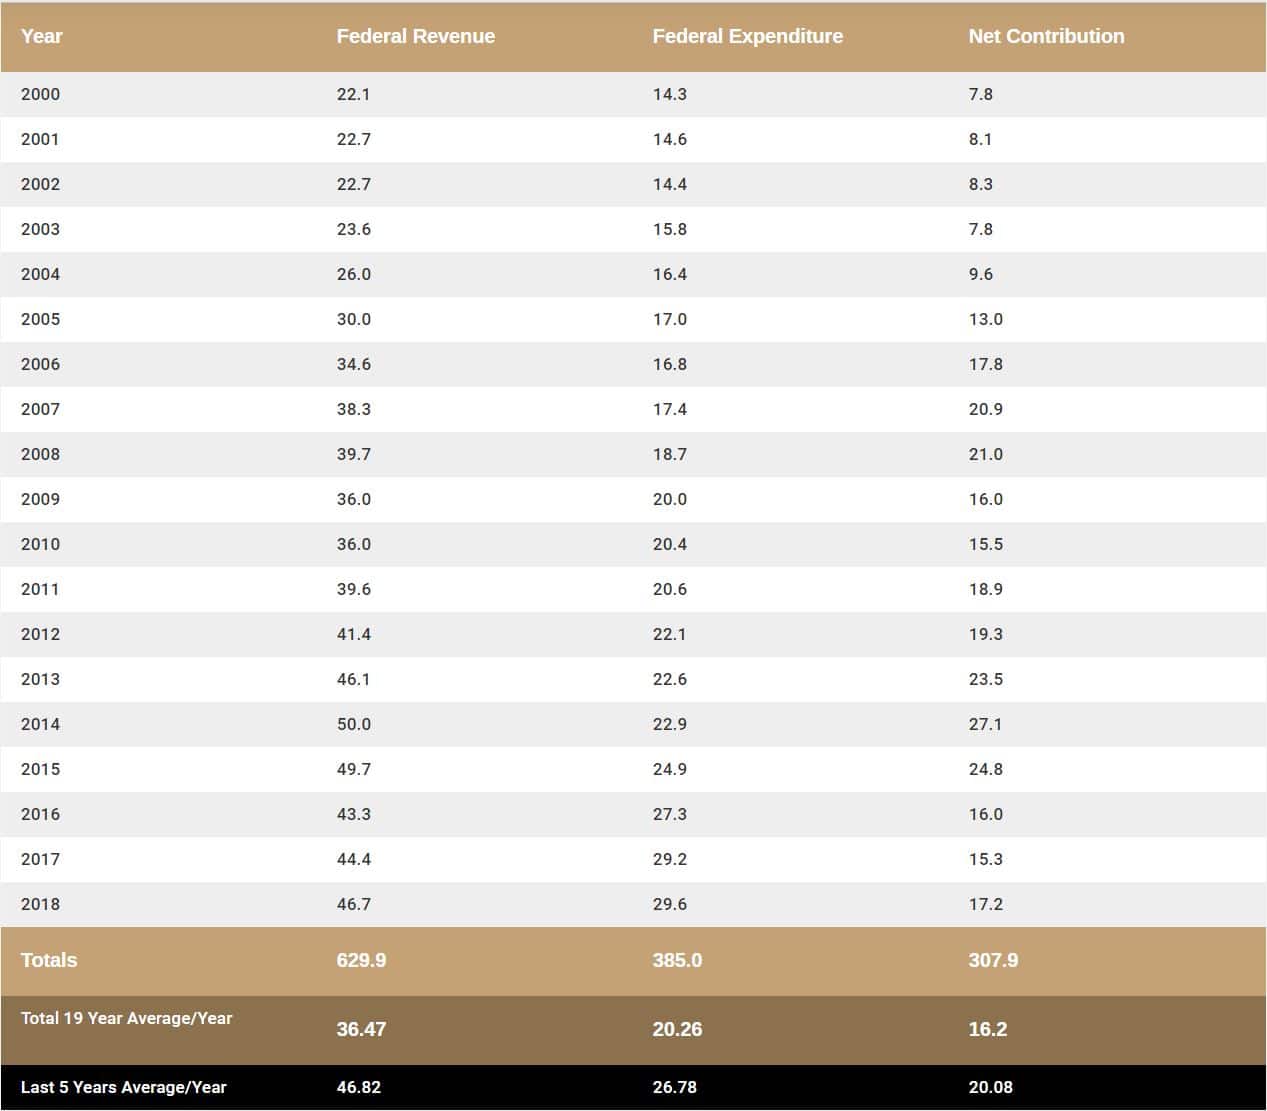
Source: Statistics Canada.
It is interesting to note that even in times of economic downturn in Alberta, Alberta’s per capita net contribution to the federal government of approximately $3,994 per year exceeds the total annual per capita contribution of all other provinces of $3,567.
Net Fiscal Contribution, $ per capita | |||||||||||||
|---|---|---|---|---|---|---|---|---|---|---|---|---|---|
Revenue | 2007 | 2008 | 2009 | 2010 | 2011 | 2012 | 2013 | 2014 | 2015 | 2016 | 2017 | 2018 | |
AB | 6,318 | 2,258 | 4,807 | 4.451 | 4,721 | 4,964 | 5,908 | 6,625 | 5,973 | 3,803 | 3,596 | 3,994 | |
BC | 1,547 | 1,013 | 212 | -408 | 301 | 707 | 686 | 1.006 | 1,227 | 1,482 | 1,718 | 2,046 | |
ON | 1,423 | 703 | -194 | -823 | -75 | 95 | 188 | 652 | 985 | 1,178 | 1,474 | 1,519 | |
SK | -1,219 | -807 | -502 | -825 | -250 | 42 | 709 | 1,141 | 960 | 111 | -321 | -271 | |
QC | -906 | -1,678 | -2,075 | -2,331 | -1,970 | -1,833 | -1,818 | -1,830 | -1,718 | -1,742 | -1,825 | -1,533 | |
NL | -4,552 | -3,313 | -5,004 | -4,981 | -3,583 | -3,211 | -2,313 | -2,052 | -2,346 | -2,627 | -2,939 | -2,032 | |
MB | -3,391 | -3,807 | -4,097 | -4,374 | -3,952 | -3,574 | -3,180 | -2,857 | -2,803 | -3,061 | -3,309 | -3,429 | |
NB | -4,941 | -5,278 | -5,871 | -6,381 | -6,169 | -5,990 | -5,849 | -5,726 | -5,876 | -5,999 | -6,269 | -6,411 | |
NS | -5,450 | -6,376 | -6,621 | -6,911 | -6,931 | -7,177 | -7,058 | -6,746 | -6,901 | -6,824 | -7,037 | -7,361 | |
PEI | -6,673 | -7,755 | -8,871 | -9,142 | -8,183 | -7,666 | -8,023 | -7,492 | -7,451 | -7,770 | -8,420 | -8,842 | |
Net Fiscal Contribution (millions of dollars) | |||||||||||||
AB | 22,201 | 22,504 | 17,686 | 16,610 | 17,888 | 19,235 | 23,518 | 27,056 | 24,756 | 15,959 | 15,259 | 17,175 | |
BC | 6,640 | 4,408 | 935 | -1,823 | 1,355 | 3,227 | 3,178 | 4,737 | 6,100 | 7,202 | 8,459 | 10,231 | |
ON | 18,164 | 9,053 | -2,525 | -10,811 | -991 | 1,271 | 2,536 | 8,881 | 13,498 | 16,343 | 20,745 | 21,750 | |
SK | -1,222 | -821 | -519 | -867 | -266 | 46 | 780 | 1,270 | 1,076 | 126 | -369 | -315 | |
QC | -6,972 | -13,026 | -16,276 | -18,484 | -15,769 | -14,779 | -14,743 | -14,911 | -14,043 | -14,326 | -15,147 | -12,856 | |
NL | -2,317 | -1,695 | -2,586 | -2,600 | -1,881 | -1,690 | -1,219 | -1,084 | -1,239 | -1,391 | -1,553 | -1,068 | |
MB | -4,034 | -4,560 | -4,952 | -5,340 | -4,875 | -4,467 | -4,021 | -3,654 | -3,622 | -4,022 | -4,417 | -4,641 | |
NB | -3,683 | -3,942 | -4,403 | -4,805 | -4,662 | -4,543 | -4,437 | -4,346 | -4,459 | -4,579 | -4,807 | -4,942 | |
NS | -5,096 | -5,967 | -6,212 | -6,511 | -6,545 | -6,772 | -6,638 | -6,331 | -6,463 | -6,434 | -6,688 | -7,063 | |
PEI | -919 | -1,076 | -1,241 | -1,295 | -1,178 | -1,108 | -1,156 | -1,081 | -1,077 | -1,142 | -1,267 | -1,358 | |
Source: Statistics Canada Table 36-10-0450-01 November 7,
2019 | |||||||||||||
It is important to note that in the context of Alberta receiving no equalization payments and making a very large contribution to the Federal Government revenues, Alberta scores near the bottom among provinces in term of the numbers of doctors and nurses, student-teacher ratios and social services employment per 100,000 of population where Alberta is the lowest in Canada (source: University of Calgary—Haskayne School of Business)
Normally, organizations re-invest in those divisions or activity centres that generate the greatest net contributions to fund the rest of the organization. This is not the case with Canada. Rather than Canadians re-investing in Alberta, or allowing Albertans to re-invest in Alberta, the opposite has consistently happened. Canada has “milked” Alberta for decades, not allowing for necessary re-investment.
Often, Alberta is compared to Norway, with statements made to the effect the resource revenue was squandered. This is not the case. Rather, it was taken by the Federal Government to meet federal spending needs in the rest of Canada.
The failure to allow for oil exporting pipelines further accentuates this failure to re-invest in the source of the Federal Government’s key revenue source.